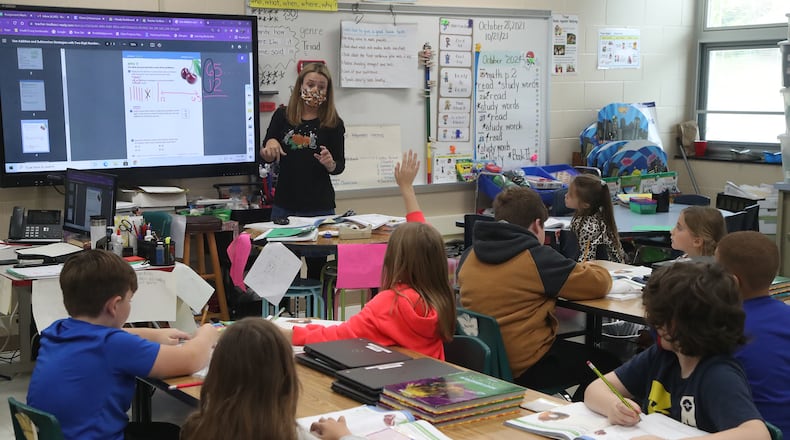
“Additionally, in reviewing our data regarding in-person versus virtual instruction, we noticed higher growth and achievement for the students that were able to attend in-person. Our percentages reflect all of our students, despite the many barriers that existed.”
Ohio’s report card system for K-12 schools usually includes letter grades for overall performance, and for a number of individual metrics — academic achievement, year-over-year progress, graduation rate and much more.
Those letter grades were not included in the report card for the COVID-disrupted 2020-21 school year, but some of the raw data was listed including academic, graduation and attendance measures.
Triad Local School District had the second-highest four-year graduation rate in Champaign County at 97.4%, according to state report card data. This is an increase from last year’s 89.2% and 93.6% in 2019.
For performance index, which measures state test performance, Triad scored 68.8%. As far as chronic absenteeism, which is when at least 10% of the year’s instructional time is missing, the district had a rate of 13.7, the second-lowest in the county. These numbers from last year were not available.
Hoffman said she thinks, for the most part, that the percentages are not accurate but they are close.
“In a district our size, a few students make up a big portion of the percentage. Non-testers and virtual students who did not see as much growth as in-person students definitely impacted the percentage, which weren’t factors in previous years,” she said.
When it comes to the prepared for success component, which is how well-prepared students are for future opportunities, Triad scored 27.8%. Last year, the district scored 28.6%.
Prepared for success data measures college and career readiness through high school students’ ACT/SAT scores, Ohio Honors Diplomas, job industry credentials, College Credit Plus achievement and more.
Hoffman said she believes many factors influenced the scores over the last few years, especially the pandemic that “created significant barriers when addressing student learning gaps.”
“Quarantines, positive cases and health measures made it difficult to find consistency in coursework and instruction. Oftentimes, social-emotional learning had to become the priority for many students. Despite the many challenges over the course of the last year, in many areas our students scored relatively close to the same way they did prior to the pandemic,” she said.
Each school and district usually receives an overall A-F grade on the report cards, and more than half of each school’s overall grade depends on how students perform on state tests each spring. The report cards also usually measure student achievement, performance index, year-over-year growth and gap closing.
Last year, schools got the equivalent of an “incomplete” mark and no A-F letter grades because there was much less data than usual. The report cards only contained a handful of normal data points as the spring 2020 state tests in English, math, science and social studies were canceled after mid-March coronavirus-related school closures. The main data categories available last year were graduation rates and high school “prepared for success” measures.
About the Author

